PCS wanted a self-service, one-stop shop for the financial advisors who use its retirement programs and services — a platform built around three business outcomes: acquiring clients, converting clients, and retaining clients.
The catch was the current state. Existing functionality was scattered across seven legacy systems — Aspireonline.com, InvestDesign Center, TSM AWEB, TSM SWEB+, IMC, ePEG, and the existing Advisor Portal — each with its own login, its own model of a client, and its own partial answer. An advisor who wanted to see their own business had to assemble it by hand, every day.
A consolidation of that size fails in a predictable way: the new platform becomes a menu of the old ones, and the advisor still has seven mental models — now behind one login.
Consolidating seven systems is easy. Consolidating them into something that isn’t just seven systems in a trench coat is the design problem.
The Approach
I partnered with project managers, sales teams, and advisors to uncover insights and translate concepts into features that addressed real customer needs — then created frameworks and prototypes to share the vision, design principles, and IA strategy so ideas could gain alignment and buy-in before they gained code.
The sequence mattered. We inventoried the current state exhaustively before proposing a structure, so the consolidation was an act of editing rather than guessing. Then we deliberately organised the new platform around how an advisor runs their business — not around the systems being replaced. Working with my project-manager partner, I defined the product to balance business goals, then prioritized and negotiated features for launch, designing across responsive screens in Adobe XD — handed to engineering as Material components in Vue — and presenting throughout the lifecycle to gain buy-in from executives and senior stakeholders.
The GAP analysis catalogued every feature, tool, report, and view across all seven systems first. It cost weeks up front, but it turned every later scope conversation from an opinion into a lookup — and made it possible to say what we were deliberately not carrying forward.
Structure around the advisor’s business, not the legacy systems
The platform resolved into four working areas — Acquisition, Onboarding, Client Management, Investment Management — that mirror how an advisor actually works. Mapping the new IA to the old system boundaries would have been faster and would have preserved exactly the fragmentation we were hired to remove.
Role-based from the start
Advisors, sales teams, and plan sponsors need different slices of the same platform. Making role the organising principle rather than a permissions layer added late meant one portal could serve every audience in the retirement ecosystem — and gave PCS an expansion path rather than a rebuild.
White-label as a platform capability, not a fork
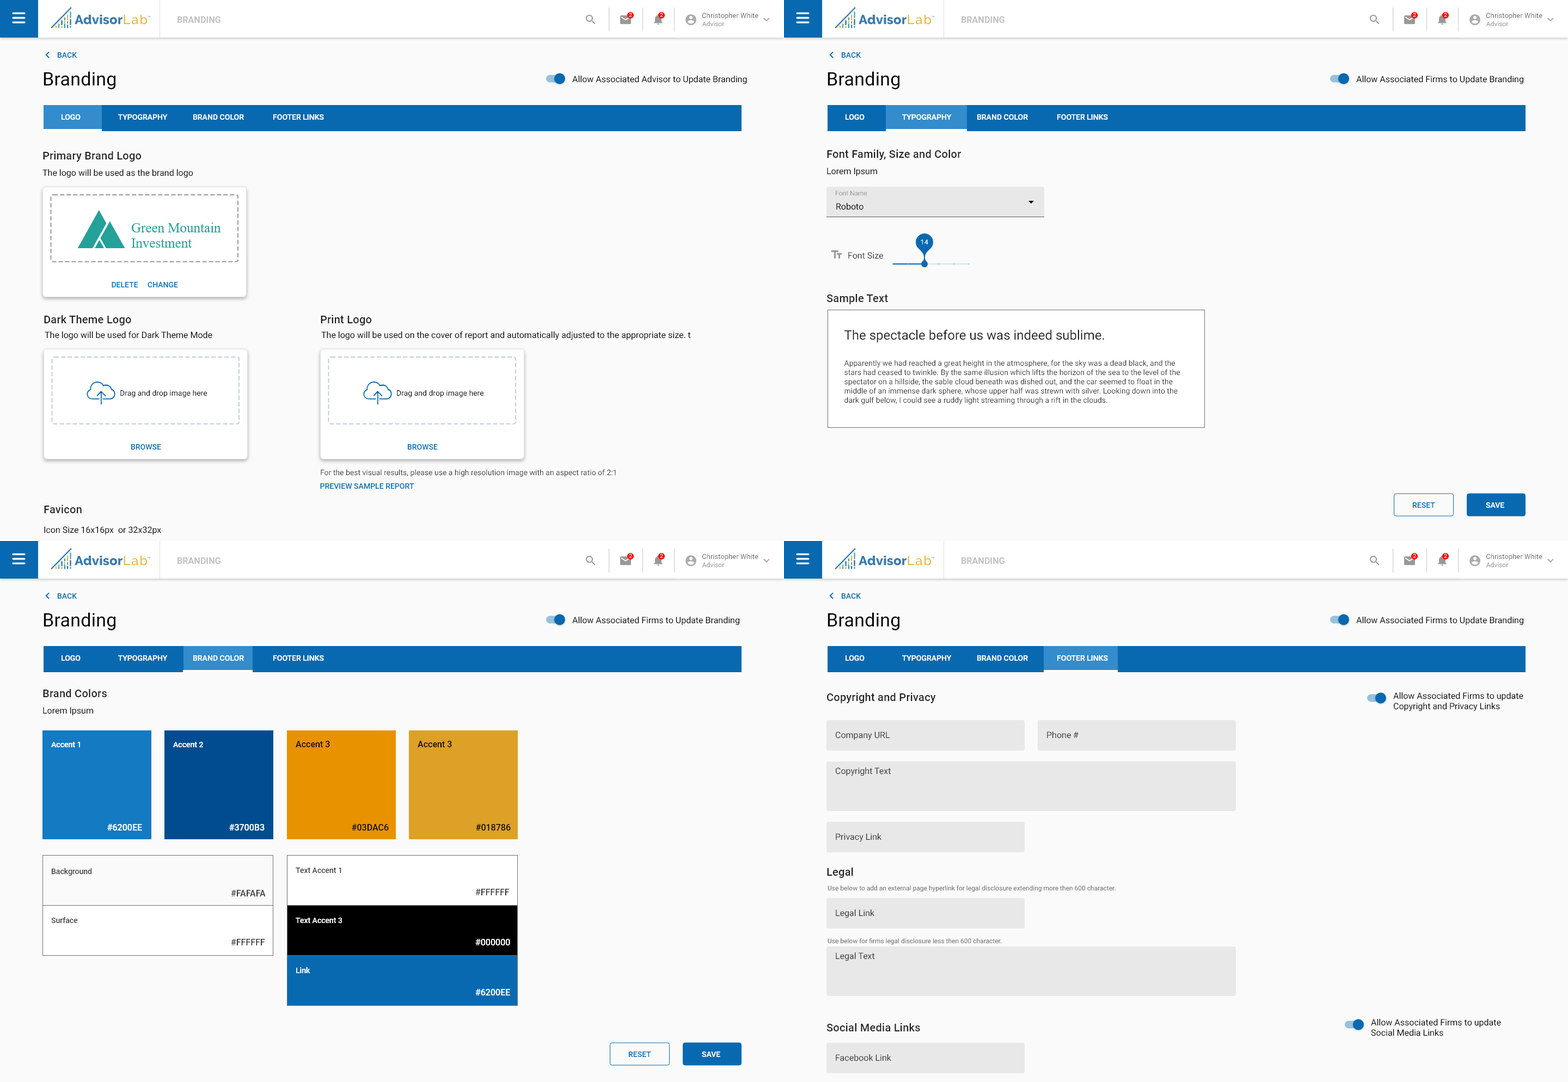
Every user’s experience resolves from their brand at runtime. Branding as configuration rather than a code fork is what let PCS serve many clients from one platform — and what kept the design system from splintering into per-client variants.
Negotiate the launch scope explicitly
A 7 → 1 consolidation can absorb unlimited scope. Defining the product against business goals with my PM partner — and cutting to a defensible launch set — was as much a design decision as any screen, because it determined which of the four areas shipped whole.
Gap Analysis
The GAP analysis inventoried every feature, tool, report, and view across the current-state systems — and became the consolidation map for the new platform.
the GAP analysis: seven systems, one inventory
Four Working Areas
The application resolved into four working areas that mirror how an advisor actually runs their business — Acquisition, Onboarding, Client Management, and Investment Management.
What each area does
Acquisition — geolocate plans, school districts, and individual accounts; prospect pipeline and lead management.
Onboarding — monitor onboarding for all plans and account transitions into the book of business; highlight delays and notify users about gaps.
Client Management — a 360° view of clients and the overall book of business; a holistic, personalized, contextual sales experience with intelligent insight guiding each step.
Investment Management — model and lineup management, investment screening and recommendations by rating and share class, data visualization and reporting per plan and participant, and fee-schedule management.
the application map: four areas, one portal
Acquisition
Geolocate plans and accounts, run a prospect pipeline, and manage leads — the top of the advisor’s funnel, mapped and searchable.
1 / 9Acquisition
Client Management
A 360° view of every client and the advisor’s whole book of business — onboarding status, activity, and a personalized, contextual experience with intelligent insight at each step.
1 / 8Client Management
Investment & Fees
Model and lineup management, investment screening by rating and share class, and fee-schedule management — the advisor’s investment engine, with reporting for every plan and participant.
1 / 3Investment & Fees
White Label
A robust, scalable brand-management solution for PCS and all of its clients — each user gets a custom experience resolved from their brand. One platform, many brands, no code forks.
white-label branding, applied live
one platform, resolved into each client’s brand
Outcome
7 → 1legacy systems consolidated into one role-based portal
4working areas — acquisition, onboarding, client management, investment management
360°view of each client and the advisor’s whole book of business
N × 1brands served by one white-label platform — custom experience per user, no code forks
Advisor Lab ended the daily context-switching that defined the old toolchain and gave PCS an expansion path — the same portal, progressively opened to every audience in the retirement ecosystem.